Now that we have our cleaned datasets, we are ready to turn df_nodes into a dummy-coded dataset.
(If you have skipped here and you don’t have the two datasets: df_nodes and df_heat, check first section 1.2 of the previous page)
Now you may be wondering: “what in the universe is a dummy-coded dataset?”
A dummy-coded dataset is a dataset having only boolean variables (i.e. a variable with only True or False). Specifically, one variable for each possible answer of the original dataset.
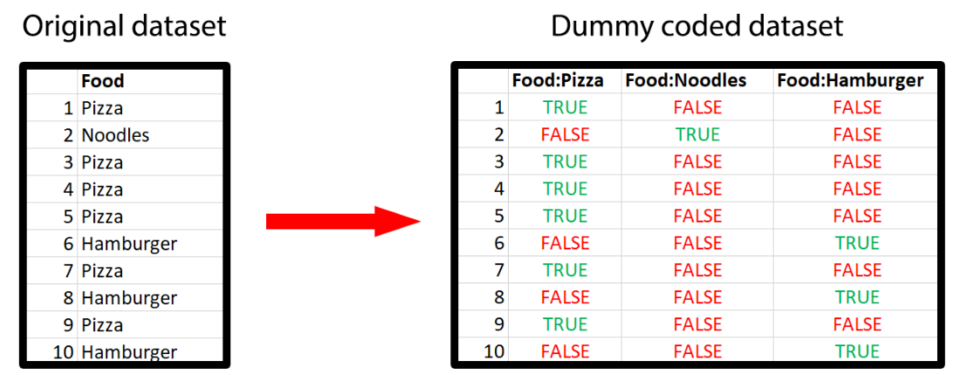
For example, suppose that in your original dataset you had a variable about favourite food that had 3 possible response options: pizza, hamburger and noodles. Then, in your dummy coded dataset you will have 3 variables. The first one (i.e. Food:Pizza) will be true for all the people who selected pizza as their answer and false for all the other people. Similarly, the variable Food:Noodles will be true for all the people who selected noodles and false for all the other people. You can see a graphical representation below.
Now, even if dummy coding is not new in the literature, some people have some questions about how to properly perform this step… and we are here to answer them.
Before jumping into the questions, however, notice that this procedure applies to df_nodes and not for df_heat. Meaning that we will not dummy-code the heat variables. Indeed, this process is necessary for creating the nodes.
q1. Should you dummy-code only nominal variables and leave all the others as they are?
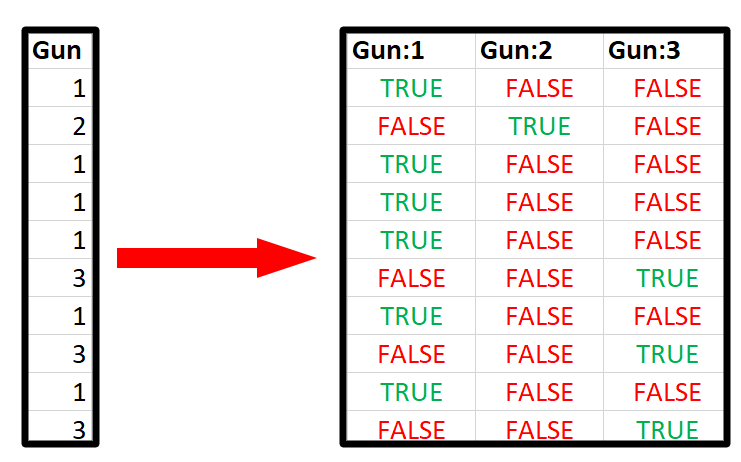
You should dummy code all the variables that you would like to turn into nodes. Which at this point should be all the variables which are in your dataframe df_nodes. See for example, how you can dummy code a non-nomial variable (in this case ordinal).
q2. Should I dummy code also continuous/interval variables? What if a variable has 100 possible responses? Should I get 100 new variables?
If you cleaned your dataset in the way we explained in the previous page, you should not have variables with tens or hundreds of possible answers (i.e. levels) in df_nodes (while you can have them in df_heat). Indeed, we suggest you to have a number of levels for a single question between 2 and 7.
If you still have variables with tons of possible answers, re-check the cleaning of the dataset, especially the part on binning (1.5).
q3. Wait, does this process destroys ordinality? Are we losing information?
The very short answer is that you are not really losing information. ResIN will actually recover the ordinal structure of the data. Furthermore, by not imposing a rigid structure on the data, it will even be able to find possible asymmetries (e.g. the belief system of the Democrats may be different from the Republicans one.)
However, if you are interested in the full explanation on this, you can check the informal explanation about ordering and the latent variable, or this article in which Resin is linked to Item response theory.
q4. Why are you doing such a thing to this poor dataset? Why not keep the variables the way they are?
It is true that this process may look unnatural at first glance (even if many methods have rather complex processing of the data under the hood). However, if you think about the “ResIN way of thinking” it is actually quite natural. We explain this in detail in this article. However, we can also give a quick example here.
Suppose the case in which Republicans really love country music over all other music genres. However, this does not mean that Democrats dislike country music or that they have a different favourite genre. Indeed, in this example, Democrats like all music genres in the same way.
Since ResIN is a “response-based” method, it will be able to show this pattern. Therefore, ResIN will “look” if there is any specific connection between Republicans and Country music, then Reps and Punk, etc. And then repeat it for Dems and Country, Dems and Punk, etc. As result, it will find that there is quite a strong connection between Reps and Country, while the other connections will be weak or absent.
Other methods, instead, since they are “variable-based”, will not output the relationship between all the possible responses. Instead, they will output the relationship between the two variables (e.g. party identification and favourite music genre) which often is summarized as a number.
Therefore, most common methods will inform us that there is a connection between these two variables (e.g. by giving us a correlation coefficient), but they will not inform us about the structure of this connection (i.e. about the fact that this connection is only due to Republicans). To retrieve this information, we should explore it manually. And if we have N variables, this will result in ~(N^2)/2 relationships to explore.
With Resin, instead, all of this will be “summarized” in a single graph. This is the reason why we need to “unpack” each variable into multiple dummy-coded variables.
2.1 Actual dummy coding
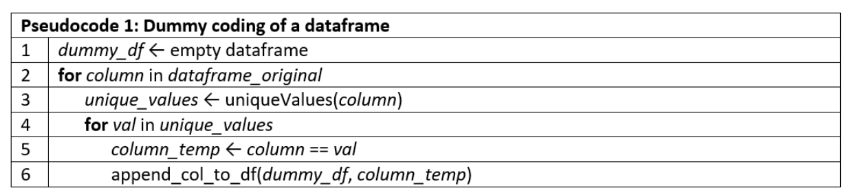
The process of dummy coding is conceptually simple:
- Take one column from the initial dataset (i.e. df_nodes)
- Get the list of the possible answers for that column
- for each possible answer…
- produce a new column which assumes the values True for the rows where that answer was selected and False otherwise
- Place this column in the new dataframe (df_dummy)
In pseudo code:
And in python code:
df_dummy = pd.DataFrame()
df = df_nodes.copy() # Select the dataframe of the nodes

list_of_columns = df_nodes.columns # here you can select a subset of columns


for col in list_of_columns: # For each column...
    values = (df[col].unique()) # ... get the list of the possible responses (i.e. nodes)

    for value in values: # For each response
        if type(value) == str: # check if the answer is type string
            name = str(col)+":"+str(value) # get the names as col:response
            df_dummy[name] = df[col] == value # get dummy-coded column

        else:
            if np.isnan(value): # if it's a refused answer
                name = str(col)+":"+"Ref"
                df_dummy[name] = np.isnan(df[col])
            else: # Otherwise
                name = str(col)+":"+str(value)
                df_dummy[name] = df[col] == value
!Warning on missing data!
While in this tutorial we already set all the variables to be string and the missing data to be labeled with “Ref,” we are leaving some room for flexibility. Indeed, the previous code will work even if you have numeric columns or pretty much any other type.
In case your column is in type float, we also added some lines to recognize NAN entries (not a number) that will be labelled as missing data (with “Ref”).
However, notice that if you are using some different labelling for missing data (e.g. “missing” or ” “) the algorithm will not be able to recognize them in the following steps.
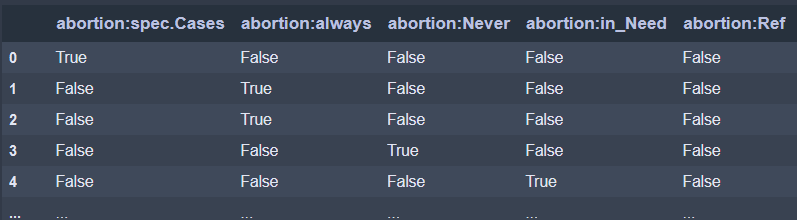
Now, if everything went smoothly, now you should have a new dataframe (df_dummy) which looks like this one:
At this point, you may start getting bored and thinking: I actually come here for a nice colorful network, and all I saw so far it’s just boring tables and code…
Worry not, because we are almost there. Indeed, in the next page we will build the actual network!