4.1 General idea
As a reminder: this section is not mandatory for making the network and it is mostly if you want to add some additional spice to it with some extra analysis. Indeed, you could use this to see if the values of a specific variable are mostly located on one side of the network. For example: is one part of the network mostly composed of men? Are some clusters more related to a certain political feeling?
In our example, we are producing a network by exploring the “interaction” of attitudes on politics-related topics. Therefore, we expect the clusters of republican attitudes to be more dominated by a positive feeling towards republicans and the democrat area to be more dominated by a negative feeling. Will this be true?
4.2 Actual code
To produce the heatmaps, we can calculate for each node its relationship with the heat-variable and store this information as an attribute of the node. In pseudocode:
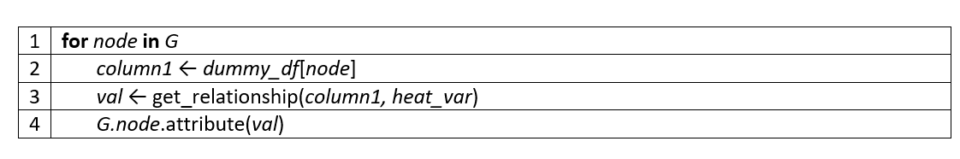
where get_relationship() can be your favourite way to check the relationship between the heat variable and the node (e.g. a correlation coefficient).
In this tutorial, we offer two examples. In the first one, for each node we calculate the average of the heat variable for the people who selected that node (i.e. that answer). For example, if we find an average of 56 on the node gun:++, it would mean that people who selected ++ as an answer to the guns question, on average rated reps 56/100.
dic_ = dict()

col_heat = df_heat["ThermoRep"] # select the heat variable

for node in G.nodes: # for each node
    col_node = df_dummy[node]

    val = np.nanmean(col_heat[col_node])

    dic_[node] = val

nx.set_node_attributes(G, dic_, "ThermoRep_mean")
Alternatively, instead of the average, we can use the correlation. For doing so we can use the following function, which avoids NAN values in the calculation:
def corr_nan(x,y):
    x = np.array(x)
    y = np.array(y)

    m = np.isnan(x) + np.isnan(y)
    mm = np.logical_not(m)

    [r,p] = stt.pearsonr(x[mm],y[mm])

    return (r,p)
and then calculate it for each node:
dic_ = dict()

type_="standard" #"sign"

col_heat = df_heat["ThermoRep"]

for node in G.nodes:
    col_node = df_dummy[node]

    (r,p) = corr_nan(col_node,col_heat)

    if type_=="sign":
        dic_[node] = np.sign(r)
    elif type_=="standard":
        dic_[node] = r

nx.set_node_attributes(G, dic_, "ThermoRep")
Here we also added the variable type_ which allows us to choose if the output should be the standard correlation coefficient (for type_=”standard”) or if we only want its sign (for type_=”sign”). The first one would be useful if we want to observe a smoother transition from democrats to republicans. The second, instead, would be better for marking the separation between the pro- and the anti-republican area.