In the following pages, you will see how you can turn a table with your data into a ResIN network that you can explore both visually and quantitatively.
As an example, we will analyze the ANES 2020 dataset (i.e. political data from the United States). From this dataset, we will explore the attitude space (i.e. the Resin network) that we obtain from 8 political attitudes. Furthermore, we will double-check how each variable correlates with the rating of republicans by producing a heatmap of the network.
To give you a visual representation of this process, we will start from data of this kind:

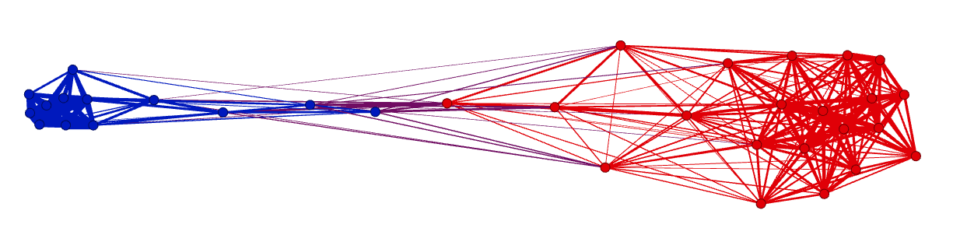
To end up with this:
Resources
All the steps are detailed in this jupyter notebook file.
The original dataset can be downloaded here.
Notice, however, that to better explore the cleaning process (and so, problems you may encounter with other datasets), in the jupyter notebook we will have one preliminary step in which we “dirty” the dataset. We will not discuss this step in this tutorial as it is not relevant to ResIN, but it is still detailed in the jupyter notebook.
If you do not have Jupyter notebook installed, you can follow this guide for windows 10 and this one for Mac Os.
If you are interested in the analysis of this specific dataset using ResIN, more information can be found in this article by Adrian Lueders.
Overview of the process
To be able to analyze a dataset with ResIN you will have to follow these steps:
- Clean/prepare the dataset
- Make the dummy-coded dataset
- Make the network
- (eventually) Color code the nodes and edges
- Analyze the network and have fun!
Terminology
ResIN is interesting for people in very different disciplines, from data science to psychology. Unfortunately, everyone has her favourite set of terms which are not consistent with other people’s choices.
Here, we include as few technical terms as possible, while also trying to use a language that can be as natural as possible to most people. Here is a list of the terms that we may use, together with a super informal explanation:
- Nodes are the dots (or circles) in the network. In our case, each one represents the answer to a specific question. In the literature, they are also referred to as vertices.
- Links/edges are the lines connecting the nodes. Notice that they may have different thicknesses depending on their weight. The bigger the weight the thicker the line. In our case, the weight will be the correlation between the nodes.
- A Graph/Network is the ensemble of nodes and links.
- A Cluster is a group of nodes strongly connected together (and usually separated from other clusters)
- Questions/Items are the questions of the survey. “Items” is the more technical term, but here making this guide accessible to as many people as possible, we will mostly use “questions.”
- Answers/Responses are the answers to a survey question.
- The Levels are the number of possible responses for a single question.