In this page, we still discuss about ResIN and its properties, but instead of providing an intuitive understanding, we focus on more formal definitions and deeper understanding of the process behind ResIN. Before reading this page, we suggest you check the introduction to ResIN for having a general understanding of what ResIN is, what is its goal and the general meaning of the network.
Definition of ResIN
ResIN is a method for processing a dataset having rows and columns to produce a spatial network (i.e. a network in which nodes also have spatial coordinates) in which the nodes are the response options.
Resin as a bipartite network projection
An alternative way to formalize ResIN is based on bipartite networks (i.e. networks in which there are two types of nodes which are connected to each other). In the standard use of ResIN for studying attitudes in a survey, the two type of nodes will be the respondents and the second the response options. Therefore, ResIN produces a projection on the attitudes.
For a detailed analysis on how people and attitudes can be modeled as a bipartite network, check out this article.
Therefore, ResIN can also be formalized as a spatial network obtained as projection of a bipartite network.
Process
The process of ResIN is the following:
- From the initial dataset D1, it is produced a dummy-coded dataset D2.
- From D2 it is produced the network G, where the nodes are the (dummy-coded) variables and the weight of the links is the correlation.
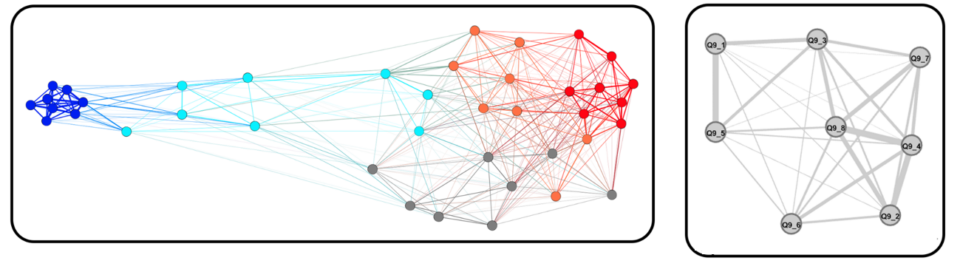
- From the network G, it is produced the spatial network Gs using a force-directed algorithm.
- (eventually) It is possible to visualize Gs simply by placing the nodes in their position in the 2D space.
Dummy coding the dataset
A detailed explanation of the dummy coding process, along with common questions can be found here. In this page, we still explain the process without covering all the technical details.
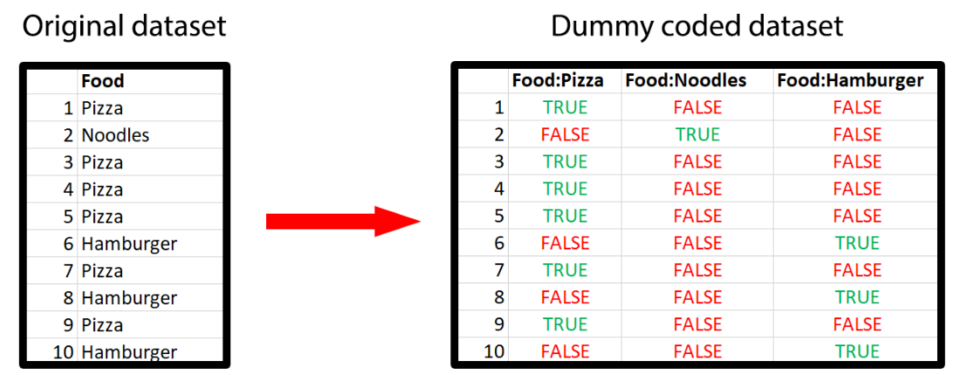
The main idea of dummy coding is that each item/question/column of the original dataset is transformed in as many new variables as the number of response options. For example, the image on the right shows how the column containing participants’ favourite food is transformed into three new columns (as we had 3 possible responses).
Should this be applied only to categorical variable? No, ResIN applies this to every variable, as we explain more in detail here.
Do we lose information about ordinality? Even if it may look like we are losing information about ordinality, this information will be actually be preserved. You can either check the naive explanation of why we re-obtain ordinality or check this article.
What is the rationale of this? Thanks to this process, ResIN allows extreme flexibility in the data. Indeed, thanks to this step it will be possible to study asymmetric belief systems (e.g. where the democrat system is different to the republican one), ordinal together with categorical data and even non-responses.
For a more detailed discussion, you can check out the dedicated page of the tutorial.
Producing the network
The network is produced from the dummy-coded dataset D2. Specifically, the nodes of the network are the columns of D2, while the weight of the links is obtained as the positive correlation between the respective variables.
Notice that since we are dealing with binary variables the phi correlation coincides with both the Pearson and Spearman correlation coefficients (i.e. all three of them produce exactly the same value).
producing the spatial network
Since the network is already produced, the last step consists in finding the spatial coordinate of each node. This can be done by using a force-directed algorithm which uses only the positive links and ignores the negatives. Alternatively, this can be done by producing a new network G2 in which the negative links are removed and using it for calculating the nodes’ position. This information is then combined the the initial network G to produce the spatial network Gs.
Why do we avoid using negative links? Because force-directed networks cannot work with negative links.
Do we lose information by neglecting the negative links? The negative links will still be included in the final network Gs. Furthermore, the calculation of the node’s position produces good results just by considering only the positive links.
Interpretations
People-oriented interpretation
In the informal introduction, we mentioned that two attitudes X and Y are connected if “people who hold X also tend to hold Y.” On this page, we formalized this relationship as a correlation and we may be wondering if the previous interpretation is still valid.
The “problem” of the previous claim was that it was too vague, therefore, we can rephrase it in terms of conditional probability. Indeed if we have two binary variables X and Y with a positive correlation, we have that the probability of observing X given we observed Y is bigger than the probability of observing X as well as the probability of observing X given that we observed not Y. In formula:
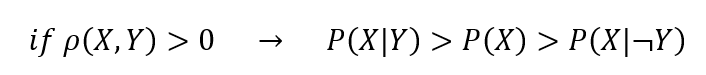
To give an example, let us suppose we are analyzing attitudes regarding music preferences and clothing. We observe a positive correlation between “liking punk music” and “wearing black clothes.” Suppose also that we have three unknown people, one liking punk music, one not liking punk music and one of which we know nothing. Then, the most likely to wear black clothes is the one liking punk music and the least probable is the one not liking it.
All of this can be rephrased in a slightly less formal way by saying that “people liking punk music are more likely to wear black clothes.”
With this interpretation, clusters are groups of attitudes for which, people holding one of them are also more likely to hold the other attitudes.
(Belief) Network and latent space
A complementary way to look at the result of ResIN is to look at it as a belief network. These are structures which allow us to understand how beliefs interact with each other.
Note that in standard Belief Network Analysis (BNA), the nodes usually are items, while ResIN uses item responses. See for example how they produce different patterns of the same dataset.
By interpreting ResIN as a (belief) network, is it then possible to analyze it using standard approaches developed in network analysis such as clustering coefficients, the centrality of nodes, etc.
Similarly, ResIN provides spatial information which are related to latent variables. This allows us to say that nodes which are close together have similar values of the latent variables. As with every latent variable method, the 2D visualization can be accurate only when the number of latent variables is either 1 or two. Therefore, if more than 2 latent variables are present in the data, the visualization will lose accuracy (while the network structure will not be affected).
What to check next?
Check out our current research (either on developing ResIN or by using ResIN) or start using ResIN with the tutorials.