ResIN is a holistic quantitative method for analysing attitude systems (even if it can be applied also to the analysis of measurement scales, analysis of online data or projections of bipartite networks in general; but more of this in the advanced concepts…)
ResIN allows you to analyze attitudes as a system, almost offering you a bird’s-eye view of the attitudes and their relationships. This is done without “forcing” the data with assumptions like linearity, monodimensionality, etc.
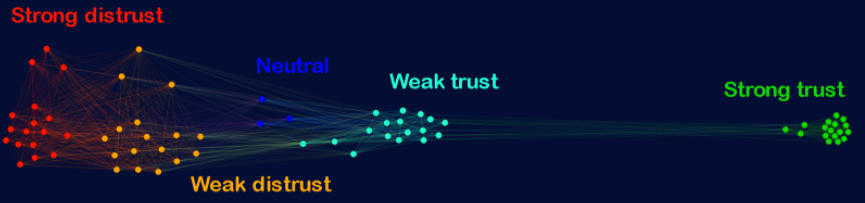
This produces informative patterns like the following one, where you can already see that the green attitudes are someway “more compact” and “separated” from the rest (even if you still don’t know how to read a ResIN graph).
At the same time, ResIN offers quantitative information, telling you, for example, the strength of the relationship between two attitudes, the number of attitudes groups, the level of coherence of a group, etc.
If you are interested in ResIN, you can start with the naive introduction, which will explain also how to intuitively make sense of the visuals.
Then, if you want to dig deeper, you can also explore the more advanced concepts both for having a deeper understanding of the visual components or for exploring the quantitative information in ResIN. You can even try Resin yourself using either this python tutorial or the tutorial for R users (coming up soon!).